 Safirion
 Português
 English
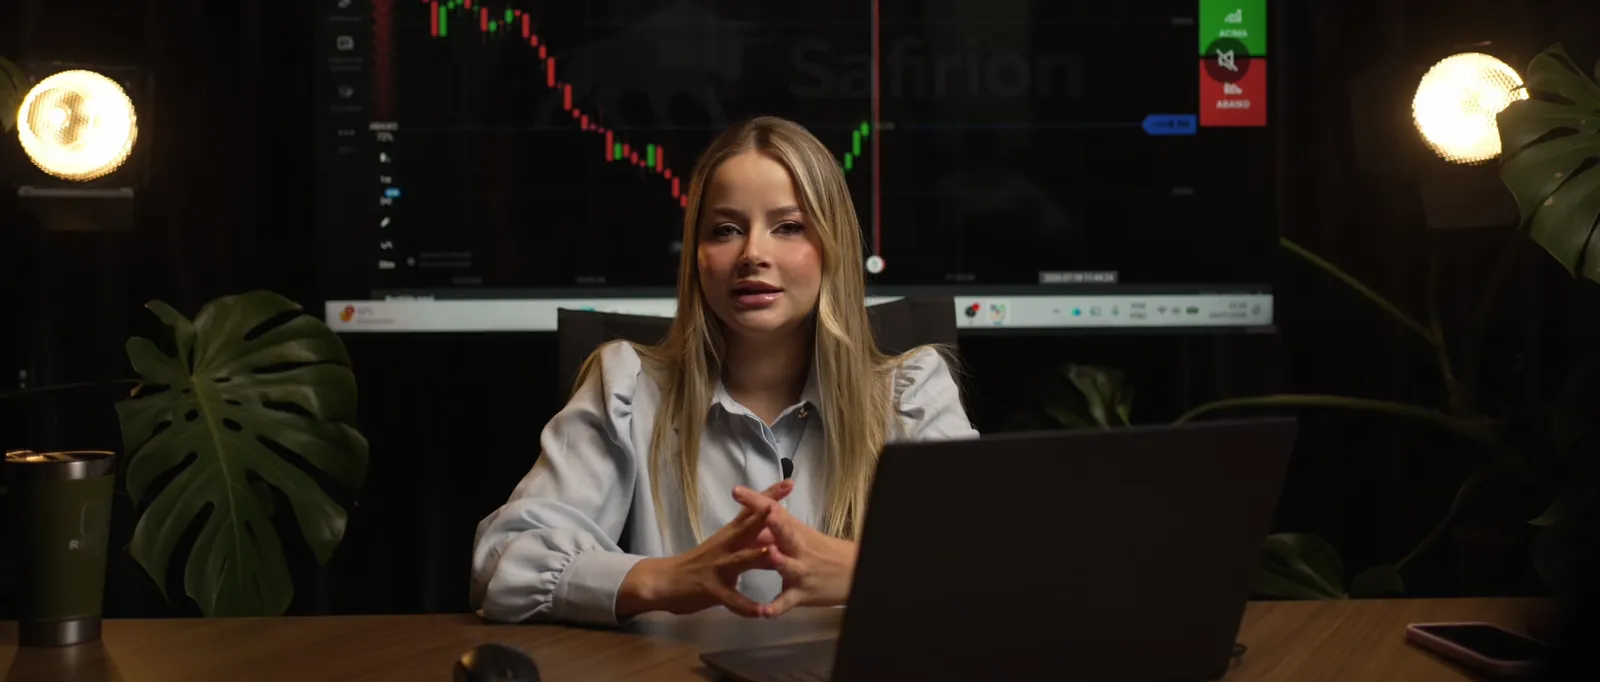
This is lesson 4 of the Safirion Course, the free Safirion course for beginners. In it, Mirielle shows how to read the chart candle by candle: which candles show strength, which show doubt and what the wick tells you about the fight between buyers and sellers. The summary is below the video, so you can check it later.
Strength candle: a strong, continuing move
The first candle in the lesson is the full-bodied candle, also called the strength candle. It can be green or red and has small wicks at the ends (it does not have to be completely "bald", but the wicks are short). When it shows up, the message is a strong move that continues in the direction of the body.
Hammer and inverted hammer
The hammer can also be green or red, and it comes in two versions:
- Normal hammer: the strength of the wick and the strength of the body point the same way. A green hammer with a buying wick is usually followed by a buy; a red hammer with a selling wick is usually followed by a sell.
- Inverted hammer: the wick points one way and the body the other. The forces are split, and you need to see which one is bigger.
The tiebreaker rule the lesson teaches: when the wick is bigger than the body, the wick's strength counts; when the body is bigger, the body's strength counts.
Indecisive candles
Indecisive candles come in many shapes, but they have one thing in common: the wicks are the same size at both ends. The selling strength at the top equals the buying strength at the bottom, so there is no clear direction, and the lesson recommends not making decisions based on them.
When the same formation shows up with one wick much bigger than the other, the market starts to show where it wants to go.
What the wick shows about strength
This is the core of the lesson. A wick at the top is selling strength, because the price went up to that point and was pushed down. A wick at the bottom is buying strength, because the price fell to that point and was pushed up.
The lesson shows this with two examples of the path inside a candle:
- The candle opens at 8, rises to 12 and closes at 9. A long wick is left at the top. Sellers brought the price from 12 down to 9, so the selling strength is in the upper wick.
- The candle opens at 15, falls to 8 and closes at 14. Even though it is red, it leaves a long wick at the bottom, and it was buyers who took the price from 8 to 14. If the wick had a color, it would be green.
That is why the color of the candle stops mattering when there is much greater strength in the wick. The two sentences Mirielle asks you to remember:
The only force capable of making the price of an asset go up is buying strength. The only force capable of making the price of an asset go down is selling strength.
Doji: the tie candle
The doji is a rare candle with no color: neither green nor red, it shows up in light gray on the chart, because the price closed at the same point where it opened. In binary options, when a trade ends on a doji it is a tie and the amount invested goes back to your account. That is why a trade sometimes shows a zero result in your history.
Practice on the demo account
The fastest way to lock in what the lesson showed is to repeat it on the chart. On the Safirion demo account you practice with virtual balance and real prices, without risking money, and switch to the real account when you feel ready.
Open an account at SafirionFree demo account, deposit from US$ 10 →Risk warning: Trading leveraged products and options involves a significant risk of loss and may not be suitable for all investors. No lesson or strategy guarantees results. Trade only with capital you can afford to lose.